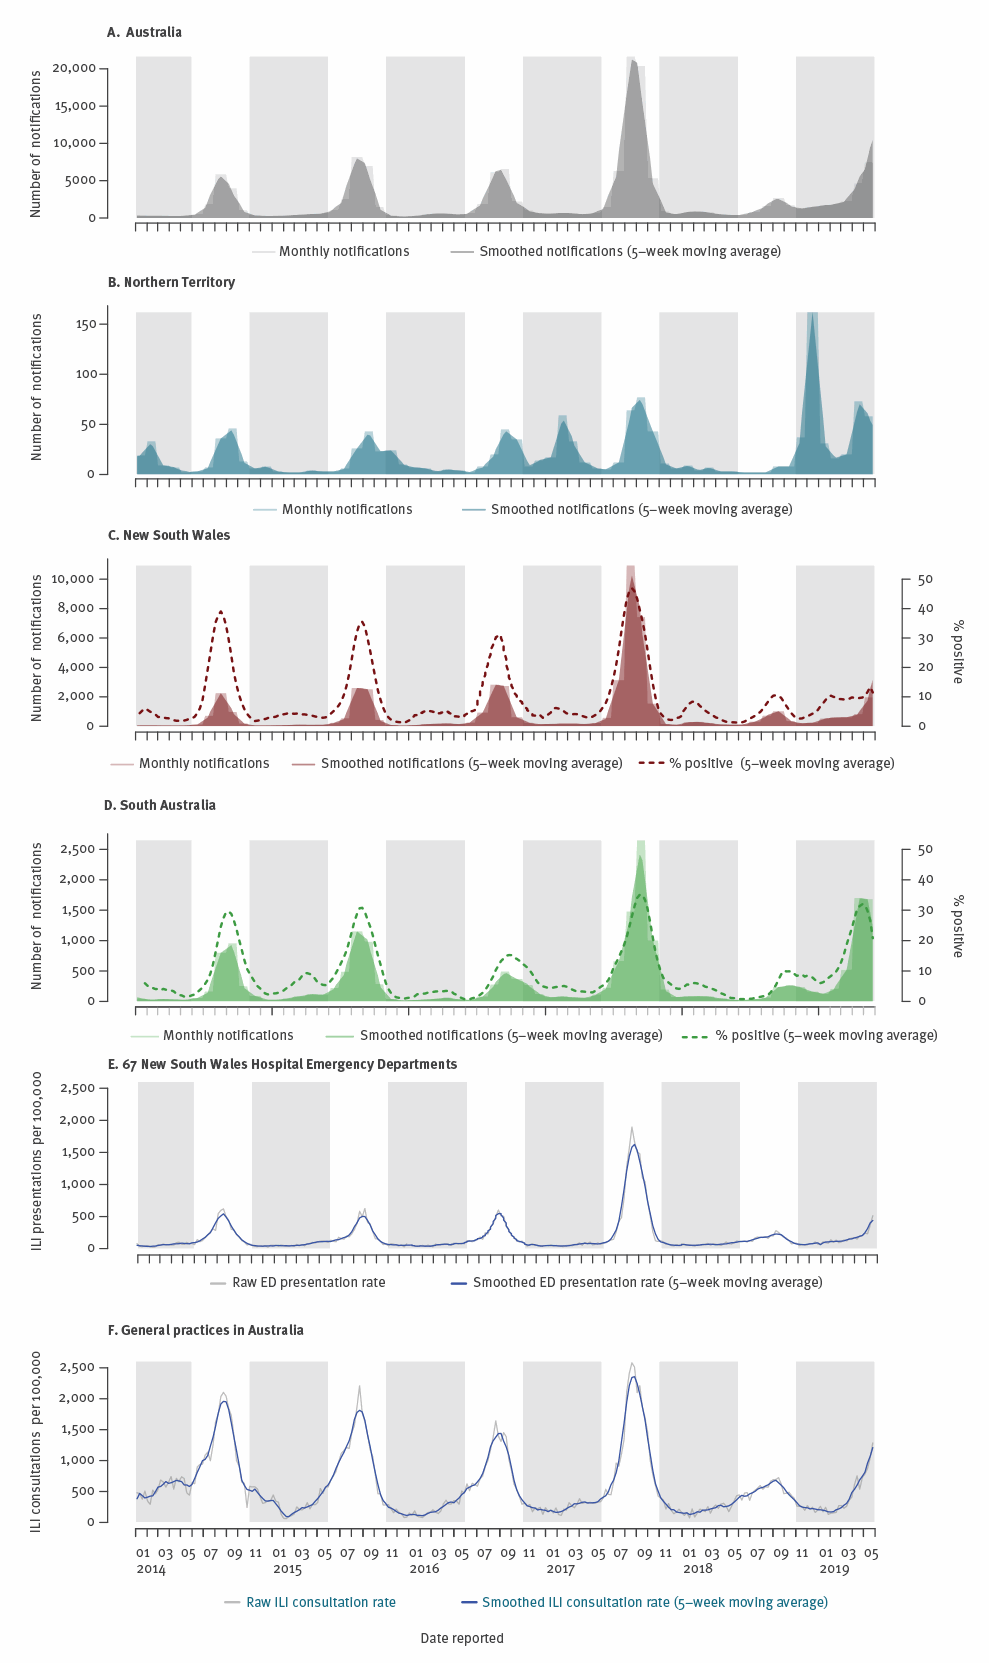
Figure 2
Selected influenza surveillance data, Australia, 2014–2019
This article is copyright of the authors or their affiliated institutions, 2019.ED: emergency department; ILI: influenza-like illness.
Influenza laboratory-confirmed influenza notifications. Dotted line in panels C and D: percentage of influenza-positive samples. Light grey bars indicate the interseasonal period 1 November–31 May for each year. All plots show raw data plus 5-week moving averages. Note that the y-axes of the different panels are not set at the same scale.
Citation:

